
US Fast-Charging Utilization Hits 15.8% in Q2 2026
America's public fast chargers are busier than ever — and the numbers behind that busy-ness say a lot about where EV charging is headed. New data from Paren's Q2 2026 State of the Industry report shows national fast-charging utilization reached 15.76% for the quarter, meaning the average high-speed port is in active use roughly one in every six minutes it's available. That's flat against a year ago, but the interesting part is what's happening underneath: operators added thousands of new ports, session volume jumped 29% year over year in June, and the industry is openly entering what analysts call "Charging 2.0."
What the utilization numbers actually say
Utilization has been remarkably stable for five straight quarters, moving within a band of less than one percentage point — from a 16.49% high in Q4 2025 to 15.64% in Q1 2026. The takeaway for drivers: demand is growing roughly in line with new supply. More ports are coming online, and drivers are filling them about as fast as they open.
That growth is real. Operators brought 4,382 new fast-charging ports online across 806 stations in Q2 2026, led by Tesla (1,185 ports, 27% of the quarter's total), followed by Walmart, ChargePoint, and Red E. Monthly session volume climbed from 14.1 million in April to 16.1 million in June, with sessions per port rising from 202.9 to 224.7 over the same stretch.
Deployment pace has cooled slightly versus 2025 — 4,382 new ports in Q2 2026 versus 4,865 a year earlier — but the mix of what's being built has shifted dramatically.
Bigger stations, faster chargers, more NACS
The new-build data reads like a checklist for Charging 2.0. About 62% of new non-Tesla ports in Q2 were rated 250 kW or higher, up from 39% a year ago, while sub-150 kW hardware fell to roughly 20% of new builds. High-power charging is now the default, not a premium option.
Stations are getting denser too. Non-Tesla networks averaged 4.4 ports per site, up from 3.6 a year earlier, while Tesla's per-site density moderated from 15.0 to 12.1 ports as it opened more locations rather than enlarging existing ones.
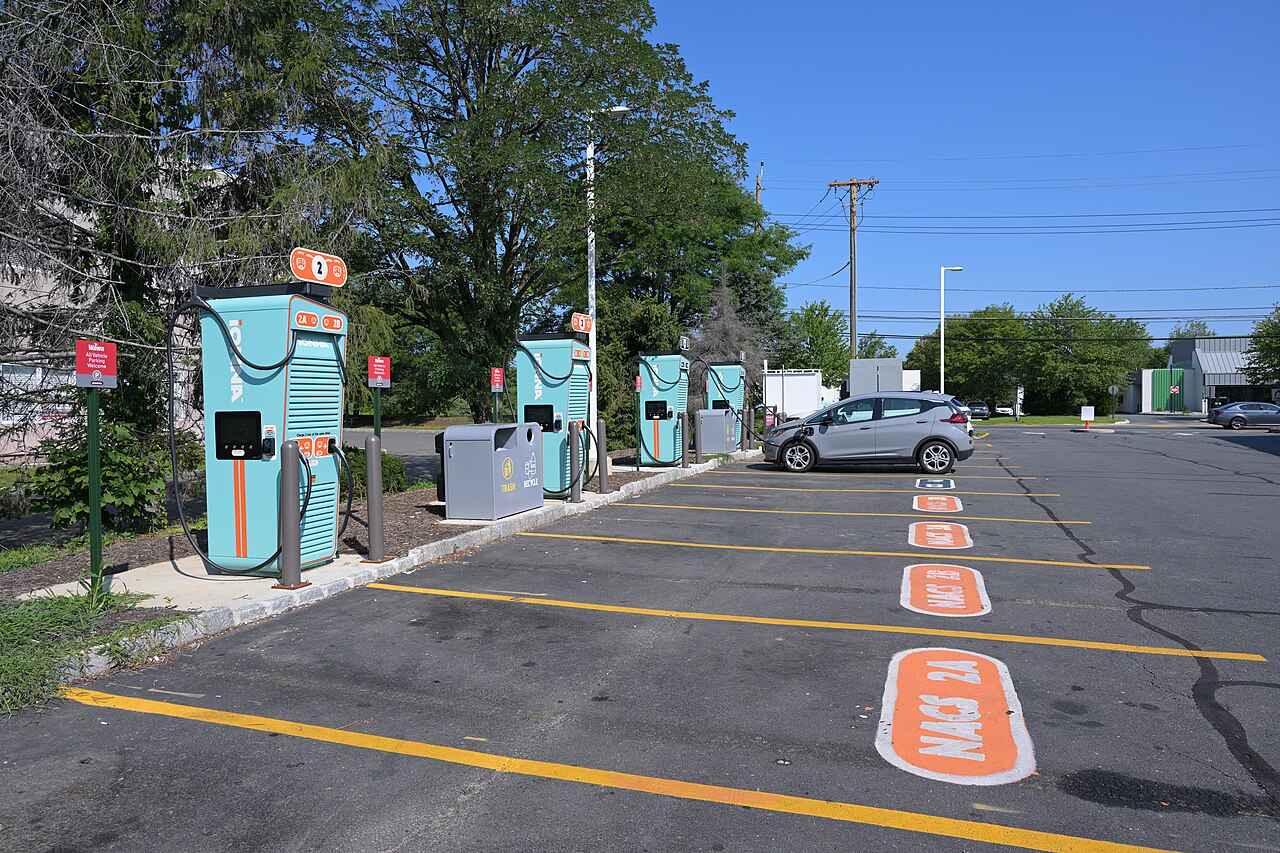
Connector strategy is a growing story. NACS made up 22.9% of new non-Tesla connectors in Q2 — more than double the share a year ago — with operators layering NACS onto CCS-first sites rather than replacing them. The installed base still trails (NACS is just 8% of non-Tesla ports), so adapters will keep mattering for a while, but the direction is unmistakable.
What this means for drivers
For EV owners, the most useful signal is geographic. Utilization runs highest in the District of Columbia (29.7%), Hawaii (28.7%), and California (23.1%) — which pairs its top-tier usage with the nation's largest footprint of 17,374 ports. Florida, Maryland, and Nevada round out the most-used networks. If you road-trip through Alaska (2.0%), the Dakotas, or Montana, expect lighter traffic at chargers.
Reliability is the other number to watch. Most states now score in the low-to-mid 90s on Paren's reliability index, with Oklahoma the laggard at 78.5. Crucially, no state combines high utilization with weak reliability — the report notes reliability is now table stakes, and poor reliability will kill utilization.
Finally, expect smarter pricing. The national average sits at $0.538 per kWh, but time-of-use pricing now covers 27% of stations, led by California at 45.3% — an early signal that off-peak charging discounts will become more common.
The takeaway? Public fast charging is getting faster, denser, and more evenly spread — and the steady utilization numbers suggest the new capacity is being used, not wasted. CalCharge's guide to how California's public network reached 250,000 ports and the 500 kW rollout at highway travel plazas are worth a read for context on where this buildout is heading.